MP3 reflationary policies produced massive injections of money and credit into economies, leading to high nominal growth, leading to self-reinforcing inflation, leading to a tightening of monetary policy which is now just beginning. Stagflation is the big risk and the war in Ukraine has added to that.
What Was Coming…
Last year, as it became clear that reflationary MP3 policies had produced a level of nominal spending growth that was far in excess of the capacity to produce, the natural result would likely be an increasing probability of a self-reinforcing inflation cycle, which would bring us to a transition in monetary policy from extremely stimulative to restrictive.
The source of this high nominal growth was the massive injection of nominal money and credit via coordinated monetary and fiscal policy (MP3). Fiscal stimulation via the monetization of government debt raised nominal income across all income groups. This provided the initial financing of a surge in nominal spending, which further raised incomes, leading to a self-sustaining, self-reinforcing process of nominal spending, financed by nominal income, financed by nominal spending.
Where Things Now Stand…
It’s been a while since we’ve been in an environment of high nominal growth, so it’s worth taking a moment to register the mechanics. Nominal growth is total spending as measured in dollars spent (or other local currency). Nominal spending is financed by money, credit, and income and breaks down into real growth and inflation. If output keeps up with nominal spending, you get more real growth. If output does not keep up, you get higher prices and inflation. Stagflation is when high nominal growth is absorbed by higher prices and leaves a low level of real growth.
The pass-through of nominal spending to inflation is the mechanical difference between nominal dollars spent and quantity produced. We illustrate this below. The red line is the difference between nominal GDP growth and a proxy for the output capacity of labor. Here, we define output of labor as the sum of the change in employment and the change in labor productivity. The blue line is inflation, as measured by the GDP deflator. As shown, the two track very closely. Since the pandemic bottom, even though employment grew rapidly and productivity was positive (i.e., labor output rose), the rise in nominal spending was far greater, and the difference flowed through to inflation, and increasingly to wages as the slack in labor was diminished. Nominal spending and output can diverge in this way because spending is a money and credit phenomenon, while output is driven by the factors of production. We now have an excess of money, credit, and income financing an excessive level of nominal spending in relation to output, with the mechanical result being higher prices on the given quantity of goods and services consumed.

Given these mechanics, a lower level of inflation requires either a lower level of nominal spending, which requires less money, credit, and income, or a much higher level of output, which requires more employment growth and productivity. As unemployment falls to a low level, employment growth naturally slows, so that’s not a sustainable solution. Productivity could rise, but the influences on productivity suggest that the upside is limited. That leaves a reduction in nominal spending growth as the only viable path to lowering inflation. That requires a credit contraction, which requires a sufficient tightening of monetary policy.
In addition, we see the following characteristics of the current environment.
- Inflation is increasingly entrenched and supplies and inventories are low.
- The potential for rapid employment growth is diminishing as economies reach full employment. This transmits an increasing portion of the high nominal income growth to wages.
- We’ve had an initial rate hike, and a series of rate hikes is now discounted with a discounted easing to follow (oddly).
- The yield curve is flat from three years to 30 years, discounting either no risk premium in bonds or a significant easing after a moderate tightening.
- A big supply/demand hole is developing in the bond market. Supply/demand pressures vary along the yield curve, with the pullback of bank purchases pushing up short-term interest rates but still a lot of liquidity going to the long end.
- The arbitrage of the breakeven inflation rate mainly occurs on the short end of the curve, with the long end impacted more by liquidity. That is leading to a big near-term hump in discounted inflation rates and then a discounted decline to a terminal inflation rate of 2.7%.
- Given the forward pricing of interest rates and inflation, the discounted real short-term and long-term interest rates five years from now are still roughly zero.
- The current configuration of pricing relative to conditions makes longer-term bonds dangerous to hold.
- A present value effect on equities has occurred due to the rise in bond yields, but discounted earnings have not changed much. The present value effect has been biggest for the most liquidity-sensitive, longer-duration cash flow companies.
- The war in Ukraine mostly accelerated/amplified pre-existing pressures, with the biggest impacts in the commodities markets where Russia is a big supplier. There was the normal short-term flight to quality, which generally lasts a few weeks to a month. After that, unfolding macro pressures typically dominate, as has been the case.
- Russia’s alignment with China has made the geopolitical conflict between the US and China worse, and other countries are increasingly being forced to choose sides, deepening and broadening the force of geopolitical conflict.
- A strong capex cycle was already underway as companies had fallen behind the surge in demand. The impact of the war will reinforce that.
- There is a debt imbalance between buyers of bonds and what governments are issuing. This will be made worse by the various financing requirements coming out of the war (reconstruction, German defense buildup, Europe reducing the dependence on Russian energy, increased onshoring of production, etc.).
Playing It Forward…
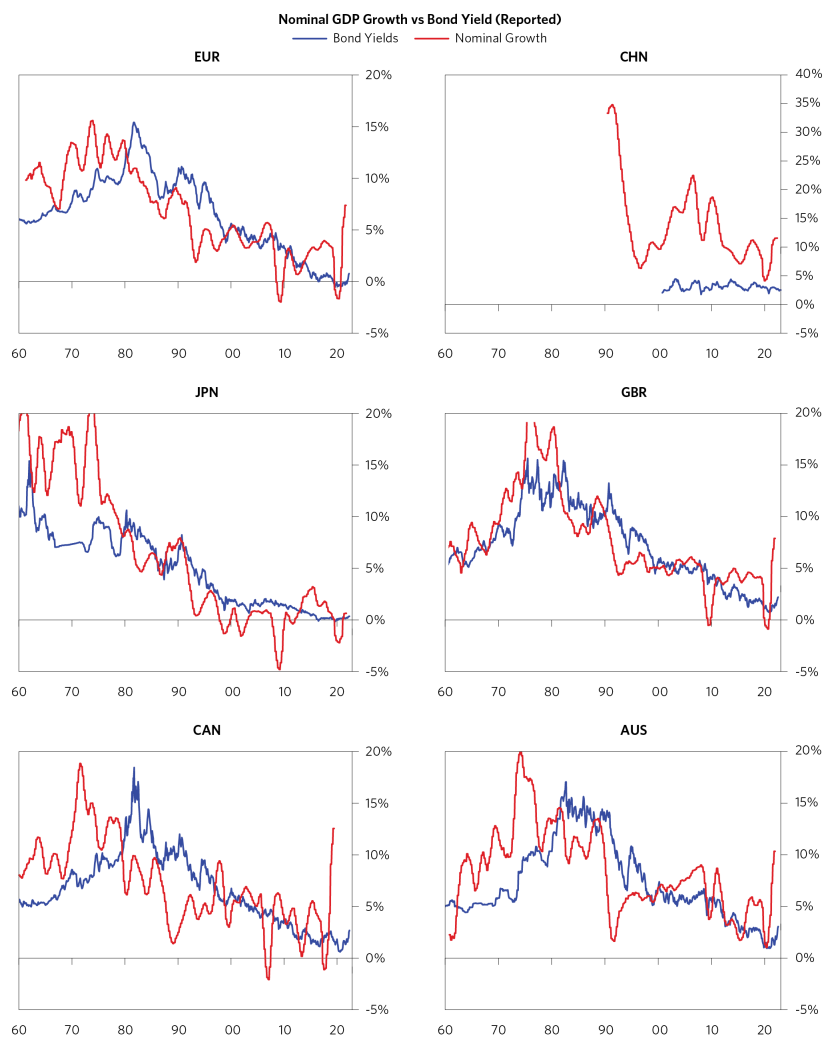
To date, there is little change in the trajectory of nominal spending. Central banks have barely begun to tighten, and the existing momentum is strong. Below, we show charts of our current read of nominal growth and our one-year leading estimate across economies. Nominal growth rates are as fast as they’ve been in the past 30 years across much of the world, and we see only minor moderation from here. China and Japan are exceptions, reflecting the degree of stimulation in response to the pandemic being much less.

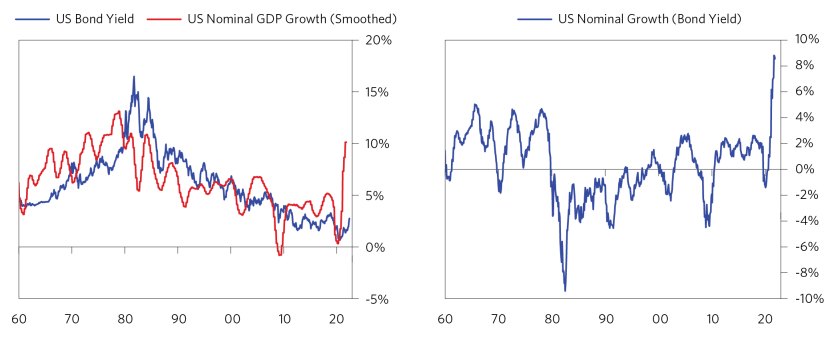
These levels of nominal GDP growth are well above the levels of interest rates, which supports the self-reinforcing nature of nominal spending, income, and credit growth. As shown, this difference in the US is as wide as any time in the past six decades.

This dynamic is similar across economies except Japan.

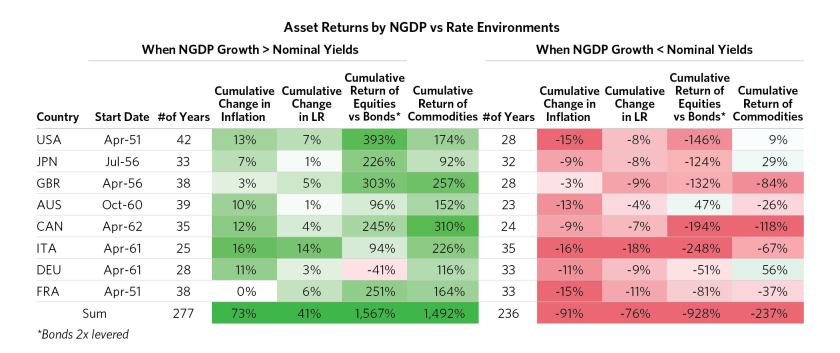
Such a wide spread between nominal GDP growth and interest rates exerts a strong influence on not only inflation but also the relative returns of assets. As shown, across countries, in periods when nominal GDP growth was well above bond yields, inflation rose, stocks outperformed bonds, and commodities prices rose. Opposite conditions produced opposite results.

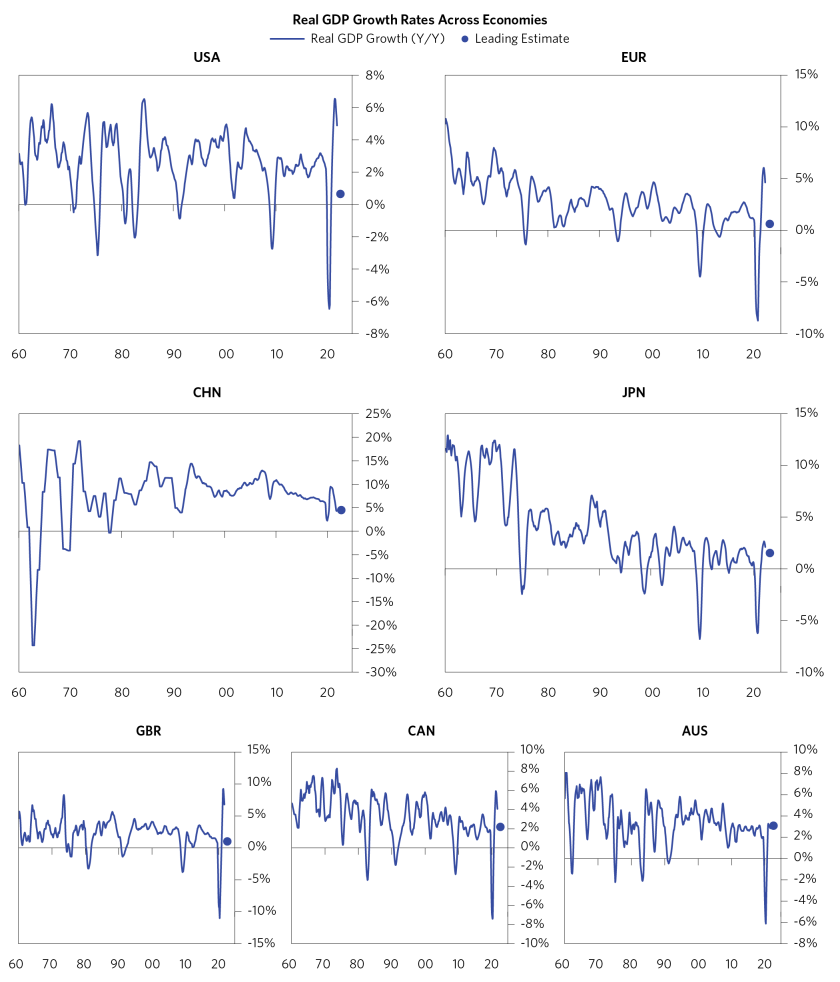
While nominal growth rates are high and have a lot of momentum, real growth is weakening. This is due to economies approaching capacity constraints so that increasingly high nominal spending is absorbed by prices, so you get less real stuff for your money. Low real growth with high inflation is challenging for central bankers because they are forced to choose between two undesirable outcomes: tighten to control inflation at the cost of an economic downturn, or don’t tighten and allow a higher level of inflation.

That brings us to the tightening: How much is required and how much will occur? We expect that a lot will be required to rein in nominal spending and inflation and that policy makers will do less than that, given their prior experiences and the risks they face.
It is important to register what constitutes an actual “tightening.” A rise in interest rates is not necessarily a tightening. What matters most is the degree of the interest rate rise relative to what is discounted and relative to economic conditions. Among the things that we look for to recognize a tightening are the following red flags.
- An interest rate rise led by short-term interest rates
- Short-term interest rates rise faster than discounted
- The rise in interest rates outpaces the pickup in nominal growth
- Real interest rates rise
- A balanced mix of assets underperforms cash
How much will occur? The Fed and other central bankers face a challenging policy dilemma with a collection of uncertainties and risks as great as any since the 1970s.
- There are uncertainties regarding the inflation dynamic. It was thought to be transitory but has not gone away. It is not the typical Phillips curve dynamic. It is a money and credit dynamic more like the 1970s.
- There are uncertainties related to COVID and its impacts on inflation and growth.
- There are uncertainties related to the war in Ukraine and its impact on growth and inflation in Europe and elsewhere.
- There is an extreme asymmetry between the ability to tighten and the ability to ease. MP3 is no longer available until either economic growth or inflation is much lower, because the high level of inflation is producing political problems. You wouldn’t want to accidentally tighten too much.
Add to that a reasonable probability that economies may actually be less sensitive to a rise in interest rates while central bankers probably expect them to be more sensitive, per the 2018 experience.
- Household balance sheets are much stronger; households are in much better shape to sustain their level of spending, even if central bankers raise interest rates higher than they have been in years. The massive injections of money and credit are now sitting in the bank accounts of households, in appreciated home values, and of course in the appreciated value of equity holdings. The wealth of the bottom 60% income group is back up to 60-year highs after sitting at 60-year lows over the prior decade.
- With respect to the potential flow of credit, banks are well-capitalized and extremely liquid. Printed money from MP3 found its resting place in a surge in banks’ core deposits, which they mostly invested in bonds and cash (central bank reserves). Bank asset allocations are now abnormally heavy in these low-yielding liquid assets, and they are reallocating into loans with plenty of balance sheet capacity to move further. The flow of credit can be sustained by the banks even if the central bank pulls back.
- The higher level of inflation means that a given rise in nominal interest rates is less consequential in real terms.
Given this blend of considerations, odds favor moving too slowly and not enough, which would make the inflation cycle more entrenched and require more aggressive action later. The longer that current conditions persist, the more challenging it will be to simultaneously achieve the desired level of growth and the desired level of inflation.
This report is prepared by and is the property of Bridgewater Associates, LP and is circulated for informational and educational purposes only. There is no consideration given to the specific investment needs, objectives or tolerances of any of the recipients. Additionally, Bridgewater's actual investment positions may, and often will, vary from its conclusions discussed herein based on any number of factors, such as client investment restrictions, portfolio rebalancing and transactions costs, among others. Recipients should consult their own advisors, including tax advisors, before making any investment decision. This report is not an offer to sell or the solicitation of an offer to buy the securities or other instruments mentioned.
Bridgewater research utilizes data and information from public, private and internal sources, including data from actual Bridgewater trades. Sources include, the Australian Bureau of Statistics, Bloomberg Finance L.P., Capital Economics, CBRE, Inc., CEIC Data Company Ltd., Clarus Financial Technology, Conference Board of Canada, Consensus Economics Inc., Corelogic, Inc., CoStar Realty Information, Inc., CreditSights, Inc., Credit Market Analysis Ltd., Dealogic LLC, DTCC Data Repository (U.S.), LLC, Ecoanalitica, Energy Aspects, EPFR Global, Eurasia Group Ltd., European Money Markets Institute – EMMI, Evercore, Factset Research Systems, Inc., The Financial Times Limited, GaveKal Research Ltd., Global Financial Data, Inc., Harvard Business Review, Haver Analytics, Inc., The Investment Funds Institute of Canada, ICE Data Derivatives UK Limited, IHS Markit, Impact-Cubed, Institutional Shareholder Services, Informa (EPFR), Investment Company Institute, International Energy Agency (IEA), Investment Management Association, JP Morgan, Lipper Financial, Mergent, Inc., Metals Focus Ltd, Moody’s Analytics, Inc., MSCI, Inc., National Bureau of Economic Research, Organisation for Economic Cooperation and Development (OCED), Pensions & Investments Research Center, Qontigo GmbH, Quandl, Refinitiv RP Data Ltd, Rystad Energy, Inc., S&P Global Market Intelligence Inc., Sentix GmbH, Spears & Associates, Inc., State Street Bank and Trust Company, Sustainalytics, Totem Macro, United Nations, US Department of Commerce, Verisk-Maplecroft, Vigeo-Eiris (V.E), Wind Information(HK) Company, Wood Mackenzie Limited, World Bureau of Metal Statistics, and World Economic Forum. While we consider information from external sources to be reliable, we do not assume responsibility for its accuracy.
The views expressed herein are solely those of Bridgewater as of the date of this report and are subject to change without notice. Bridgewater may have a significant financial interest in one or more of the positions and/or securities or derivatives discussed. Those responsible for preparing this report receive compensation based upon various factors, including, among other things, the quality of their work and firm revenues.

